Twitter/X Analytics by Nuelink
Track your Twitter/X performance with precision using Nuelink’s analytics feature.
From follower growth to engagement tracking, Nuelink gives you the insights you need to optimize your Twitter strategy and grow your audience without guessing.
Features
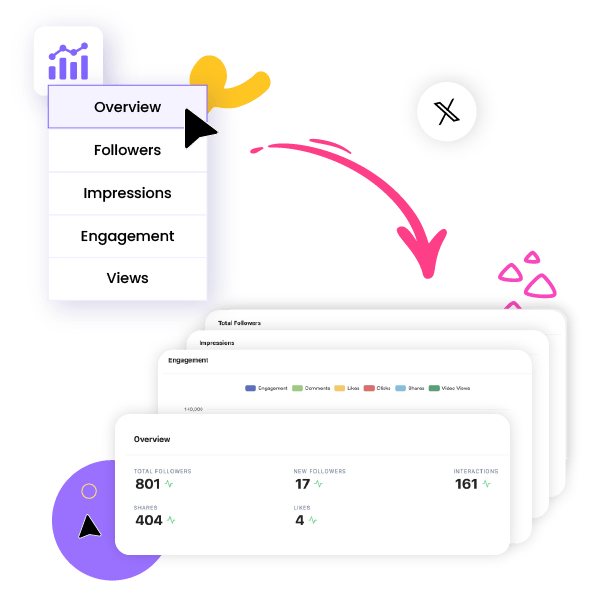
Twitter/X Performance Overview
Monitor your Twitter/X account’s performance at a glance:
- Total Followers (with daily % changes)
- New Followers
- Interactions
- Shares
- Likes
The percentage changes next to each metric make it easy to see how your performance evolves over time and measure the impact of your actions.
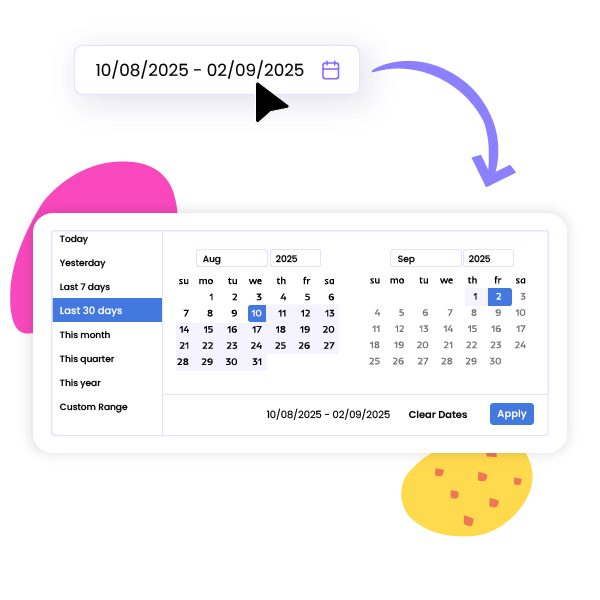
Custom Date Range Filtering
The analytics dashboard allows you to filter your Twitter/X data using a flexible date range selector.
Choose from preset options like Last 7 Days, Last 30 Days, This Month, or select a custom start and end date.
All charts and metrics adjust automatically to reflect the chosen time period.
Best Time to Post on Twitter/X
Nuelink analyzes when your audience is most active and engaged by looking at historical data.
A heatmap displays engagement by day and hour, helping you:
- Identify peak posting times for maximum reach
- Avoid low-engagement slots
- Align your content scheduling with audience behavior
This ensures your tweets and threads go live when your followers are most likely to engage.

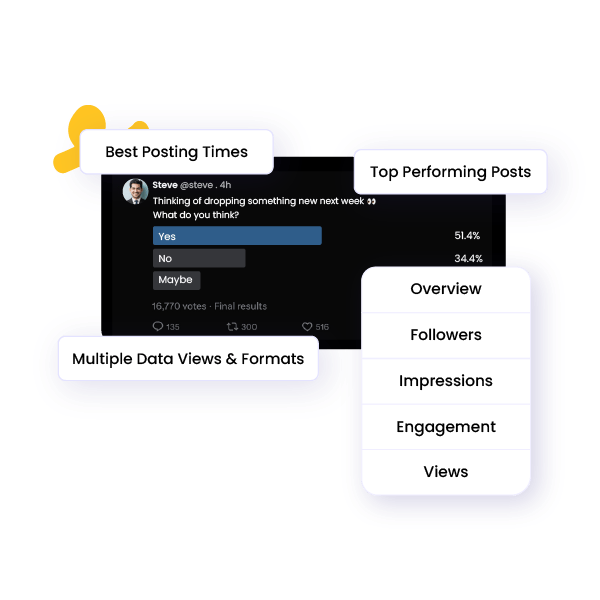
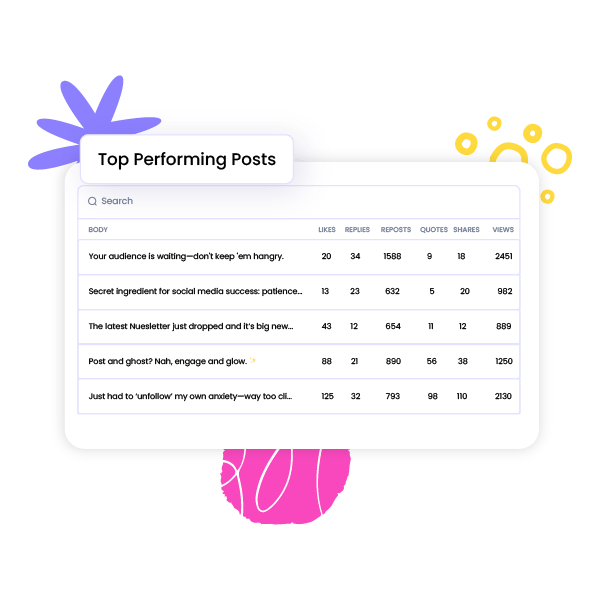
Top Performing Tweets
The analytics dashboard highlights your best-performing content across metrics such as Likes, Shares, Interactions, and Reach.
Each post is listed with a preview, and the table is sortable and searchable.
You can spot what type of content resonates best, refine your posting strategy, and generate reports for your team or clients.
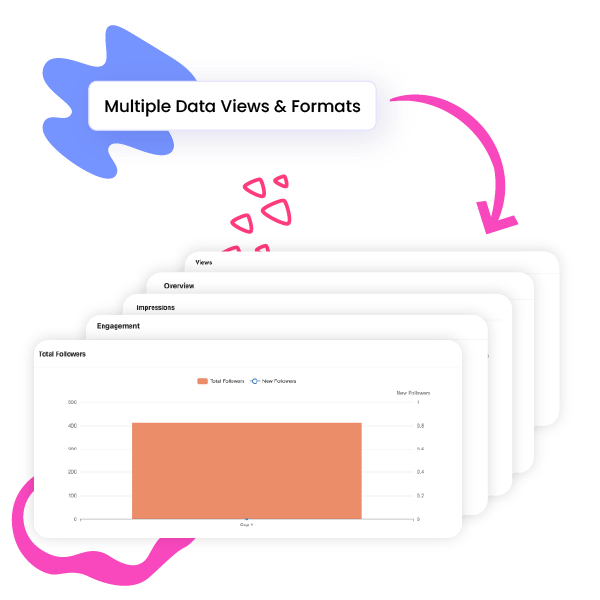
Multiple Data Views and Formats
Nuelink’s Twitter/X analytics dashboard offers flexible ways to visualize your data.
You can view growth/decline percentages, analyze trends over time, and deep-dive into post-level insights.
This flexibility makes it easy to extract the insights that matter most for your goals.
Custom Report Downloads
Export clean, professional Twitter/X reports in one click.
You can include:
- Overview
- Follower Insights
- Engagement Breakdown
- Best Posting Times
- Top Performing Tweets

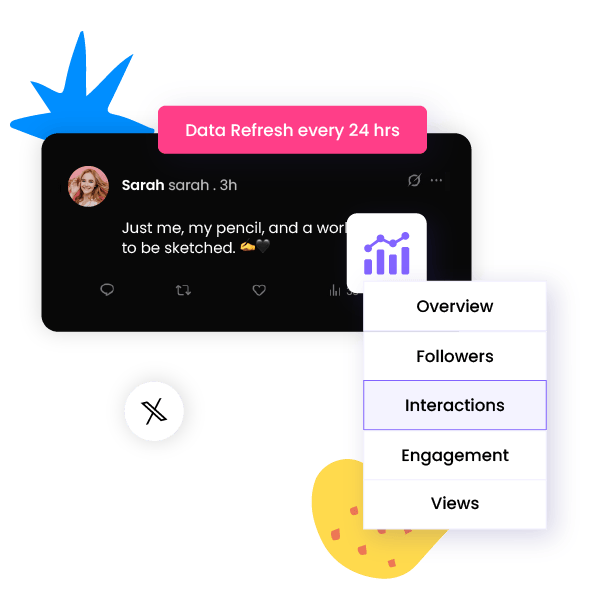
Data Refresh Schedule
The analytics dashboard automatically updates your Twitter/X data every 24 hours
This includes all key metrics like followers, interactions, shares, and post performance.
You’ll always be working with the freshest insights.
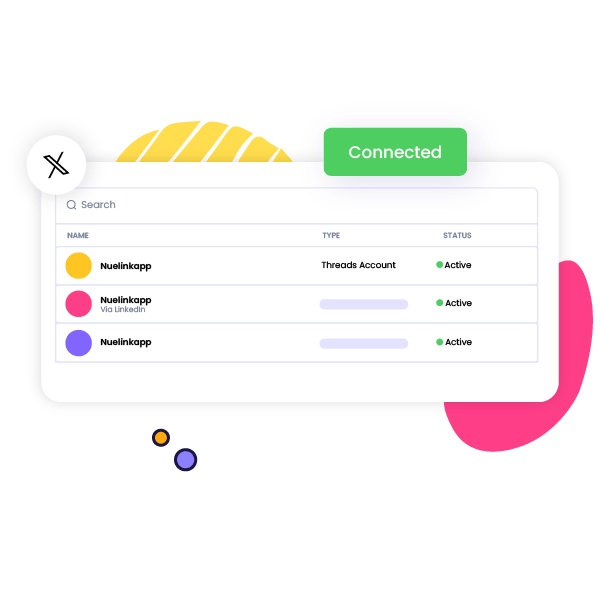
Easy Analytics Setup Process
Connecting your Twitter/X account to Nuelink is quick and simple.
Once connected, analytics sync automatically without requiring any complicated setup.
Your first data set appears within minutes, with full metrics available within 24 hours.
New · Works with ChatGPT & Claude
Tell your AI what to post. Nuelink publishes it.
Already use ChatGPT or Claude? Connect it to Nuelink in a couple of minutes via MCP, then just type what you want: “write three posts about our summer sale and schedule them for next week.” It drafts them and adds them to your schedule, across the accounts you've connected.
Just type what you want
Ask in plain English: “turn this blog into 5 posts,” “schedule this for Friday.” Your assistant does the steps; you just talk.
It can't go rogue
Your AI only posts to the accounts and time slots you've already set in Nuelink. Want a checkpoint? Tell it to save drafts for your approval.
Free on every plan
API & MCP access from day one, even on the free trial. No developer tier, no extra fee.
Generate your key
Settings → API → Create token.
Connect your tool
Add mcp.nuelink.com/mcp to Claude or ChatGPT.
Just ask
"Show my collections, then queue a post about X."
Celebrate 4 years with 4 months free
For a limited time, choose any yearly Nuelink plan and get 4 months free.
Plan your content, automate your posts, and keep your social media active for the next year without paying for the full year.
Free trial included · Cancel anytime.
EXCLUSIVE OFFER 🚀
Get the social presence you deserve.
STANDARD
$12/month USD
$ 18 /month USD
$144 paid yearly 🎁 4 months free
$0.00 due today- 10 Social Channels
- 1 Brand
- 1 Member
- 10 Automations
- 10 Collections
- 500 Nue AI Credits
- 365 Posts in Queue
- 1 Link in bio
- API & MCP Access
PREMIUM
$32/month USD
$ 48 /month USD
$384 paid yearly 🎁 4 months free
$0.00 due today- 30 Social Channels
- 3 Brands
- 3 Members
- 30 Automations
- 30 Collections
- 3,000 Nue AI Credits
- Unlimited Posts
- 3 Link in bio
- API & MCP Access
BUSINESS
$52/month USD
$ 78 /month USD
$624 paid yearly 🎁 4 months free
$0.00 due today- 60 Social Channels
- 6 Brands
- 6 Members
- 60 Automations
- 60 Collections
- 6,000 Nue AI Credits
- Unlimited Posts
- 6 Link in bio
- API & MCP Access
AGENCY
$85.3/month USD
$ 128 /month USD
$1024 paid yearly 🎁 4 months free
$0.00 due today- 100 Social Channels
- 10 Brands
- 10 Members
- 100 Automations
- 100 Collections
- 10,000 Nue AI Credits
- Unlimited Posts
- 10 Link in bio
- API & MCP Access
AGENCY-PLUS
$152/month USD
$ 228 /month USD
$1824 paid yearly 🎁 4 months free
$0.00 due today- 300 Social Channels
- 30 Brands
- 30 Members
- 300 Automations
- 300 Collections
- 30,000 Nue AI Credits
- Unlimited Posts
- 30 Link in bio
- API & MCP Access
Recognized by industry leaders


Support
Zero-AI Customer Service
Unlike other tools, we offer human customer service that starts from day one, regardless of your plan. For agencies, we include Priority Support to ensure your questions are answered, issues are addressed, and suggestions are heard promptly. We're here for you!
Sanae
Bilal
Bouchra
The Nuelink Support Team has been awesome to work with!! Special thanks to Sanae for making sure I got what I needed in record time! We're new to the platform, but so far loving their analytics and all the functionalities within!
Mary Norwood
Brand Manager | WSS Solutions